Zeta potential of the polymer electrolyte laminated film
3.Results and discussion
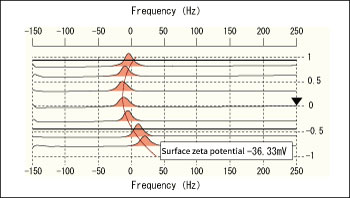
Fig. 2, 3, and 4 show an electroosmosis plot of the slide glass only, the slide glass immersed in an aqueous solution of polyethyleneimine, the slide glass immersed immersed in an aqueous solution of sodium polystyrene sulfonate, respectively. A slide glass is set at the bottom of each figure (the part marked -1). Each peak is approximated by a quadratic curve, and the intersection of the function and -1 is the surface zeta potential of the flat plate sample. However, since the code shown in the figure is the one seen from the particles being electrophoresed, the code of the flat plate sample is reversed. The electroosmosis plots in each case have different curve, which indicate different charge states on the glass slide surface.

Fig. 2 Electro-osmosis plot of the slide glass
.jpg)
Fig. 3 Electro-osmosis plot of the slide glass immersed in an aqueous solution of polyethyleneimine
.jpg)
Fig. 4 Electro-osmosis plot of the slide glass immersed in an aqueous solution of sodium polystyrene sulfonate.
Fig. 5 shows the surface zeta potential of slide glass measured after being immersed in cationic and anionic polyelectrolytes alternately. The slide glass, which originally has a negative surface zeta potential, has a positive surface zeta potential when immersed in an aqueous solution of cationic polyelectrolyte polyethyleneimine, which indicates that the cation is adsorbed on the surface of the slide glass. After immersed in an aqueous solution of anionic polyelectrolyte polystyrene sulfonate, the surface has a negative potential. Even after the second repeated operations, the absolute value differs depending on the process, but the sign inversion of surface zeta potential is clearly observed.
.jpg)
Fig. 5 Changes in surface zeta potential when polyelectrolytes are alternately adsorbed on a slide glass
The reversal of charge did not occur clearly after the second operations in such experiments until now although polyelectrolytes have often been continuously added by immersing in a cationic polyelectrolyte solution and then in an anionic polyelectrolyte solution in sequence. However, these results indicate that the reversal of charge sign can be clearly observed by performing a cleaning operation after immersing the slide glass in a cationic and anionic polyelectrolyte. It is considered that the free polyelectrolyte that was not adsorbed may have some effect on the surface zeta potential measurement without the cleaning operation.


 Close
Close

